The return is a measurement system, not a feeling
Content marketing ROI is not a number your agency reports at the end of the quarter. It is a measurement system you build before the first article is written: the full cost stack priced, the attribution model chosen in advance, and the CAC payback computed from your own funnel numbers. Most content operations fail the same quiet way — they publish on enthusiasm, measure nothing for three months, then discover forty articles produced no pipeline and nobody can say which ten should never have been written. The fix is not more content. It is a ledger: every dollar of production and tooling on one side, every lead, customer, and dollar of gross profit on the other, joined by an attribution rule decided before the results arrive.
If the system cannot produce those two numbers, the operation is not measuring ROI. It is reporting traffic.
The cost stack, priced from the vendors
The stack has three layers: production, measurement tooling, and distribution. Production is the largest and the least standardized, so state the assumption and hold it constant: this guide prices production at 300 dollars per article all-in — writer, editor, and design — as a stated assumption for the worked examples, not a market rate. Tooling is the layer you can price exactly, because the vendors publish it.
| Tool | Entry plan | Monthly billing | Annual billing | What it measures |
|---|---|---|---|---|
| Semrush | SEO | 139 dollars a month | 117.33 dollars a month billed annually | Rankings, keywords, site audit, AI visibility |
| Semrush | Starter | 199 dollars a month | 165 dollars a month billed annually | SEO plus AI search for small teams |
| Semrush | Pro+ | 299 dollars a month | 248 dollars a month billed annually | Multi-market SEO and AI visibility |
| Ahrefs | Lite | 129 dollars a month | 1,290 dollars a year | Rankings, site audit, 750 tracked keywords |
| Ahrefs | Standard | 249 dollars a month | 2,490 dollars a year | 2,000 tracked keywords, 2 years of history |
| Ahrefs | Advanced | 449 dollars a month | 4,490 dollars a year | 5,000 tracked keywords, 5 years of history |
| HubSpot | Marketing Hub | No dollar price published | No dollar price published | Multi-touch revenue attribution, Enterprise only |
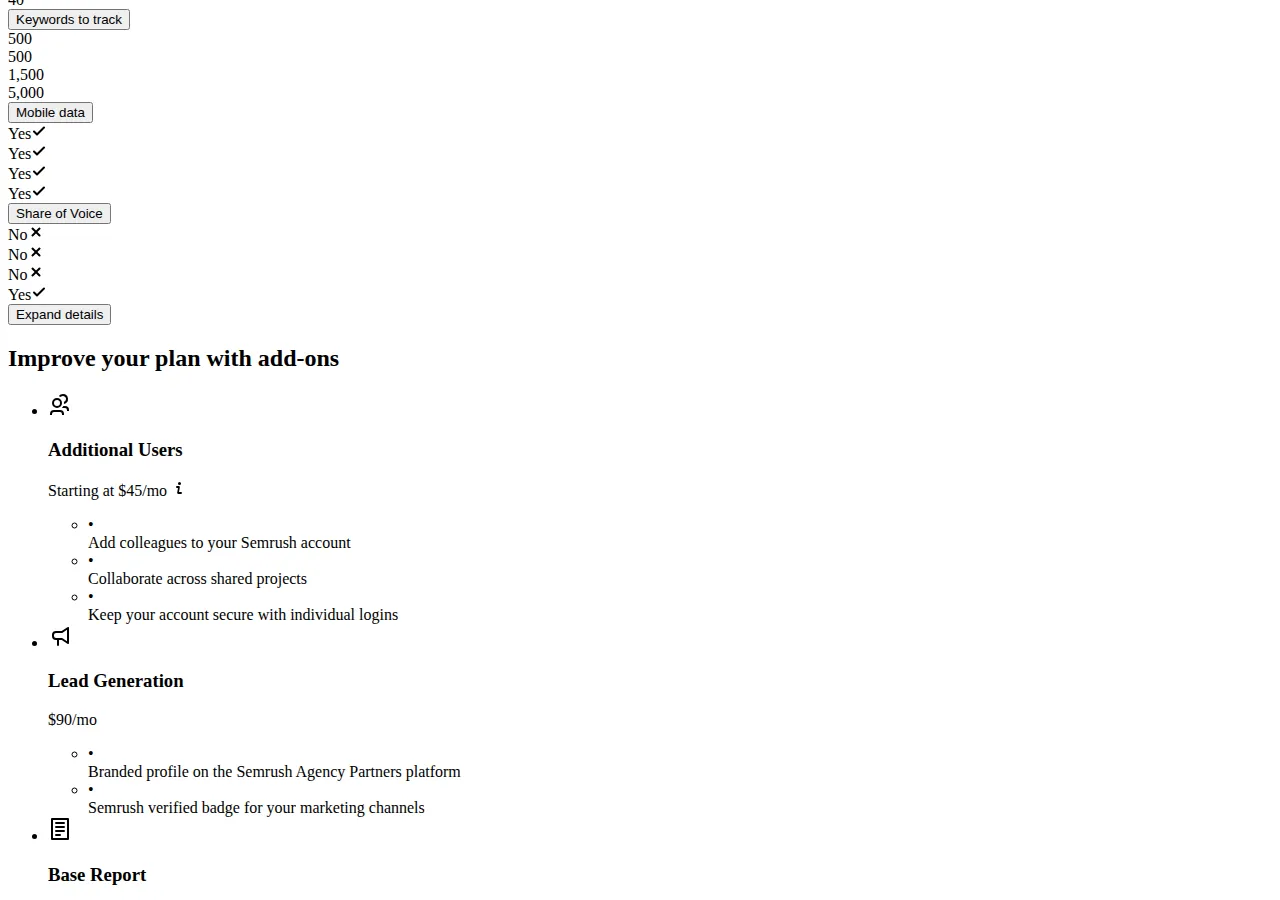
The Semrush prices come from the vendor's own pricing page, read this cycle: the SEO plan shows 117.33 dollars a month billed annually instead of 139 dollars monthly, and the page offers up to 17 percent off for annual billing. The Ahrefs prices come from the vendor's pricing page data, also read this cycle: Lite at 129 dollars a month or 1,290 dollars a year, Standard at 249 or 2,490, Advanced at 449 or 4,490, Enterprise at 999 a month or 9,990 a year. Ahrefs add-ons carry their own prices: Content Kit from 99 dollars a month, Report Builder 99 dollars a month, Traffic Analytics 99 dollars a month, and extra users at 40, 60, and 80 dollars a month on Lite, Standard, and Advanced. Semrush add-ons are priced the same way: additional users from 45 dollars a month, lead generation 90 dollars a month, Base Report 10 dollars a month, Pro Report 20 dollars a month.
HubSpot is the exception that proves the rule. Its pricing page publishes no dollar figure for Content Hub or Marketing Hub tiers — the page lists features, contact tiers, and HubSpot Credits, but the price is quote-only. Multi-touch revenue attribution, the feature that would actually measure content ROI inside HubSpot, is Enterprise-only and tracks up to 10,000 logged interactions per contact. Treat any HubSpot figure in a competitor's comparison as an estimate, and get the quote in writing before it enters your budget.
The annual-billing saving is real money at small scale. Semrush SEO on annual billing costs 117.33 x 12 = 1,407.96 dollars a year against 139 x 12 = 1,668 dollars monthly — a saving of 260.04 dollars a year. Ahrefs Lite on annual billing costs 1,290 dollars against 129 x 12 = 1,548 dollars monthly — a saving of 258 dollars a year. Together the two annual plans save 518.04 dollars a year against monthly billing, which is more than a month of the combined tool stack. Buy annual only after the first quarter proves the tool earns its seat; before that, monthly billing is the cheaper experiment.
Attribution: choose the rule before the results arrive
Attribution is the rule that decides which article gets credit for a customer. The model must be chosen before the results arrive, because choosing it after is choosing the answer. Five models cover nearly every B2B operation.
| Model | Rule | When it is honest | When it lies |
|---|---|---|---|
| First-touch | 100 percent to the first interaction | Short cycles, one dominant channel | Ignores everything that closed the deal |
| Last-touch | 100 percent to the last interaction | Direct-response pages, demo requests | Credits the closer, erases the opener |
| Linear | Equal split across all touches | Long cycles with many real touches | Rewards spam touches equally with real ones |
| Position-based | 40 percent first, 40 percent last, 20 percent middle | Most B2B funnels: opener and closer matter most | The 40/20/40 split is a convention, not a measurement |
| Data-driven / multi-touch | Algorithmic weights from your CRM data | HubSpot Enterprise, enough volume to model | Needs volume; small samples produce noise, not insight |
Last-touch is the default in most analytics setups, and it is the model that kills content budgets. A guide that introduced the buyer six months ago gets zero credit when the buyer finally converts on a pricing page, so the guide looks worthless and the pricing page looks like a miracle. First-touch has the opposite flaw: it credits the opener and erases the closer. Position-based is the honest default for a small team — it credits both ends of the journey — and data-driven multi-touch is the upgrade once the CRM holds enough closed deals to model. Google Analytics 4 reports last-touch by default in most views, so check the model before quoting its numbers to a CFO. The full multi-touch framework is our marketing attribution multi-touch playbook, and the budget question — how much goes to content against paid search — is our SEO vs PPC budget allocation playbook.
Worked example: the funnel, the CAC, and the payback
Assumptions, stated up front: 8 articles a month at 300 dollars all-in, Semrush SEO at 139 dollars a month, Ahrefs Lite at 129 dollars a month, on monthly billing. Monthly content cost is 8 x 300 + 139 + 129 = 2,668 dollars. Annual content cost is 2,668 x 12 = 32,016 dollars.
The funnel, at steady state: 40,000 organic sessions a year from the content library, converting to leads at 2 percent, and leads closing at 5 percent.
- Sessions: 40,000 a year
- Leads: 40,000 x 2 percent = 800 a year
- Customers: 800 x 5 percent = 40 a year
- Content CAC: 32,016 / 40 = 800.40 dollars per customer
At 500 dollars of monthly gross profit per customer, CAC payback is 800.40 / 500 = 1.6 months. At steady state the 40 customers produce 40 x 500 x 12 = 240,000 dollars of annual gross profit against 32,016 dollars of content cost, so every dollar of content spend returns 7.50 dollars in first-year gross profit at steady state, a net ROI of 650 percent.
The first year is lower, and the honest version says so. Content has a three-to-six-month lag: articles published in January start producing pipeline in April or later, so customers arrive evenly through the year and average about six months of payments in year one. First-year gross profit is therefore 40 x 500 x 6 = 120,000 dollars, and first-year ROI is (120,000 - 32,016) / 32,016 = 275 percent. The 650 percent figure is the steady-state run-rate, not the first-year result, and any vendor or agency quoting the steady-state number as year-one ROI is selling the lag away.
The per-article cost curve
Tooling is fixed; production scales with volume. The tool stack of 268 dollars a month — Semrush SEO at 139 plus Ahrefs Lite at 129 — spread across the article count is the per-article tool cost, and it falls as volume rises.
| Articles a month | Production (300 dollars each) | Tool stack | Total monthly cost | Tool cost per article |
|---|---|---|---|---|
| 4 | 1,200 dollars | 268 dollars | 1,468 dollars | 67.00 dollars |
| 8 | 2,400 dollars | 268 dollars | 2,668 dollars | 33.50 dollars |
| 16 | 4,800 dollars | 268 dollars | 5,068 dollars | 16.75 dollars |
The lesson is not that more articles are always cheaper — production dominates at every volume — but that the tool stack is never the reason a program is expensive. At 4 articles a month the tools are 18 percent of cost; at 16 they are 5 percent. A team that cancels the measurement tools to save money has cut the instrument panel to save fuel. The right question is whether the marginal article earns its 300 dollars of production, and only the attribution system can answer it.
Distribution is the third layer of the stack, and at content volumes it is nearly free. Emailing each guide to the list costs little: Resend's free tier covers 3,000 emails a month, Postmark Basic is 15 dollars for 10,000, and paid amplification is a choice, not a requirement — a guide that cannot earn organic distribution is a guide that should not be amplified with paid spend. Price distribution the same way as production and tooling, in the same sheet, and the full vendor comparison is our Resend vs SendGrid vs Postmark transactional email pricing playbook. A content program that measures production and tooling but ignores distribution is measuring two-thirds of its cost.
What breaks ROI measurement
Dark social. Buyers share links in Slack, WhatsApp, and email, and those visits arrive as direct traffic with no referrer. A guide that drives ten Slack shares a week can look like it drives nothing. Tag every link with UTM parameters and treat direct-traffic growth alongside content publication as a signal, not a coincidence.
Assisted conversions. A guide that never converts directly but appears in the path of half your closed deals is doing the work. GA4's assisted-conversion reporting and HubSpot's multi-touch attribution exist for exactly this case; last-touch reporting hides it.
The lag. Content compounds over months, and a quarterly review punishes it for the lag. Measure cohorts, not calendar quarters: the January cohort's pipeline in June, the February cohort's in July. A cohort view shows the payback curve; a quarterly view shows a cost with no return yet.
Sample size. A model built on twelve closed deals is noise. Below roughly fifty closed deals a year, use position-based attribution and manual deal review — read the CRM notes on how each customer actually found you — instead of pretending an algorithm has enough data.
Founder & CEO Insight — Enow A. Jovial
The measurement run-book
Build the system in three steps, in order:
- Price. List every cost: production per article at your real rate, the tool stack at the vendor's published price, and distribution spend. Put the total in a sheet the CFO can open.
- Attribute. Pick one model — position-based for most teams — set it in GA4 and the CRM, and tag every link with UTM parameters before the next article ships.
- Review by cohort. Every month, review the cohort from six months ago: sessions, leads, customers, gross profit, and CAC payback. Kill, update, or double down on articles by cohort performance, never by last week's traffic.
- [x] Cost stack priced — production, Semrush, Ahrefs, and distribution in one sheet, with annual-billing savings shown.
- [x] Attribution model chosen — one model, set in GA4 and the CRM, before the next article ships.
- [x] UTM tagging live — every content link tagged, so dark social does not hide the work.
- [x] Cohort review scheduled — the six-months-ago cohort reviewed monthly, with CAC payback computed.
- [x] Kill rule written — the payback threshold below which an article is updated, merged, or retired.
Content ROI is not a report. It is a ledger, an attribution rule, and a cohort review — and the operators who run all three know, to the dollar, whether the next article is worth writing.