A $10,000 monthly video budget buys 555,556 YouTube impressions at a $9 CPM or 1,225,490 TikTok impressions at a $4.08 CPM. The cheaper platform is not the better buy until the funnel is run: YouTube turns 31.9 percent of impressions into billable views at $0.028 each, TikTok turns 0.61 percent into clicks at $0.67 each, and the CPA side has no YouTube counterpart — the published median is $17.07 on TikTok, and no named vendor publishes a YouTube CPA median. This guide prices both platforms from the benchmarks actually published in 2026, runs the arithmetic the medians imply, and shows where they contradict each other and what to do about it.
What each platform sells, in one paragraph
YouTube sells attention inside an intent engine: a viewer searches for a video, chooses it, and watches it, and the advertiser pays per 30-second view. TikTok sells attention inside a discovery engine: a viewer scrolls a feed, the algorithm serves a video it predicts will stop the scroll, and the advertiser pays per thousand impressions or per click on an in-feed ad that looks like the content around it. The difference is not the video. It is the moment: YouTube's viewer arrived with a question, TikTok's with time to kill.
Why it matters
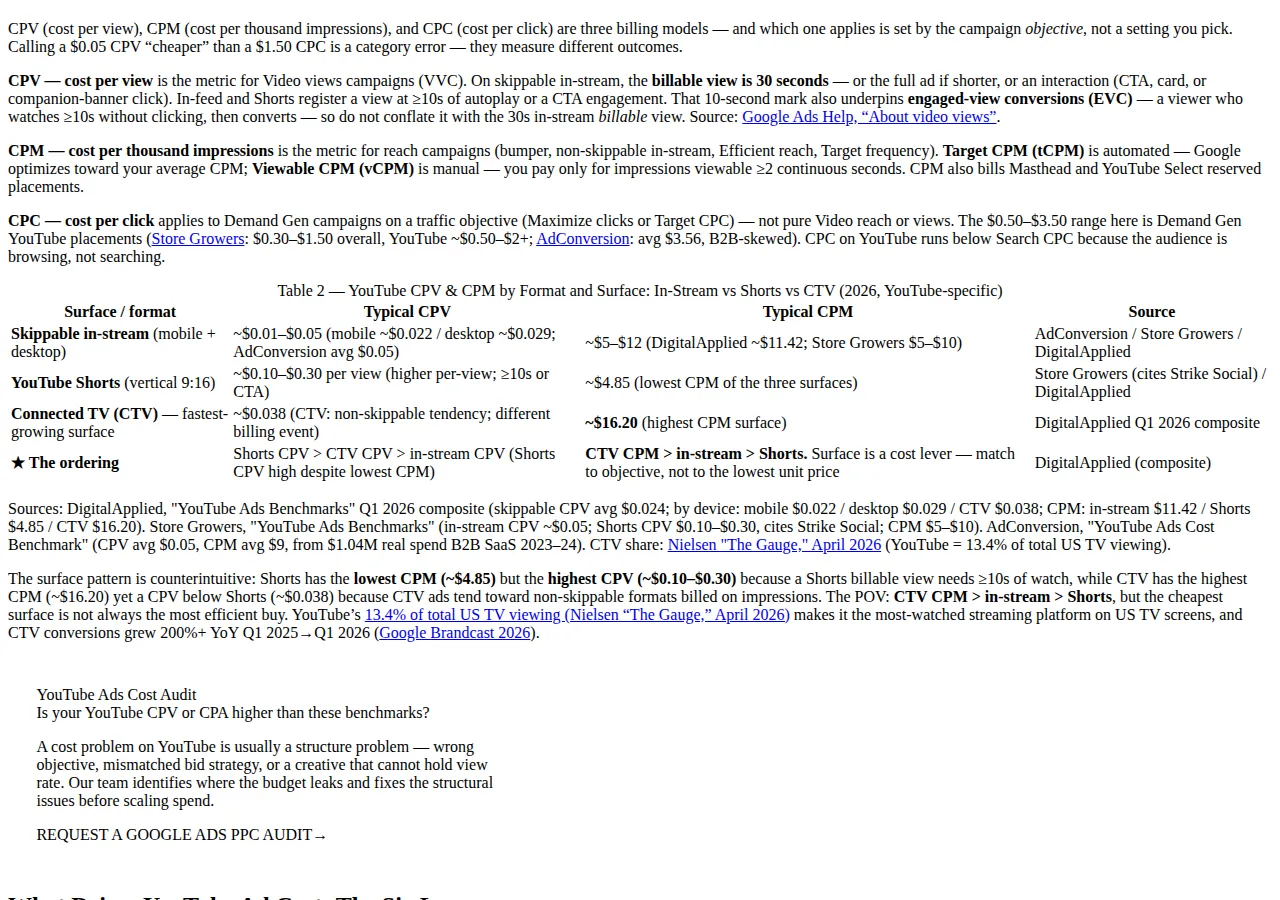
Video is the most expensive attention a small business can buy, and the two platforms bill for different things. YouTube's skippable in-stream bills on cost per view: a viewer who skips before 30 seconds costs nothing. TikTok's in-feed bills on CPM or optimized CPM: every served impression costs money whether the viewer engages or not. A buyer who compares the two CPMs and picks TikTok has compared the wrong numbers — the right comparison is cost per view on YouTube against cost per click on TikTok, then cost per order on each, with the invalid-traffic rate applied to both. The second reason is creative: a 30-second YouTube spot and a 9-second TikTok clip are different products, and a budget split across both is a bet on two creative teams, not one.
The billing models: what you pay for, by format
| Format | Billing | What triggers the charge | 2026 benchmark |
|---|---|---|---|
| YouTube skippable in-stream | CPV | 30 seconds watched, full ad if shorter, or an interaction | $0.01–$0.05 per view, average $0.05 |
| YouTube non-skippable in-stream | CPM | Served impression | $8–$20 per thousand |
| YouTube Shorts ads | CPV / CPM | 10 seconds watched or CTA engagement | CPV $0.10–$0.30; CPM $4.85 |
| YouTube Connected TV | CPM | Served impression | $16.20 per thousand |
| TikTok in-feed ads | CPM / oCPM | Served impression | $5.40 per thousand, retail |
| TikTok Spark Ads | CPM / oCPM | Served impression | $6.98 per thousand, retail |
| TikTok TopView | CPM | First video on app open | $14.20 per thousand |
| TikTok Shop product ads | CPM | Served impression | $10.20 per thousand |
Three format facts from the 2026 guides this article opened: TrueView was retired as a brand in 2024 and rebranded as skippable in-stream; Demand Gen replaced Discovery campaigns and now serves YouTube, Discover, and Gmail from one creative set; and Target CPV replaced Maximum CPV for new Video views campaigns in April 2025. None of the three changes the economics — only what the campaign is called in the interface, which is why older guides quote rates for products that no longer exist.
Founder & CEO Insight — Enow A. Jovial
The published benchmarks, with their datasets attached
Every figure below is a published median with the dataset that produced it. The datasets are not the same — that is the point of the next section.
| Metric | YouTube | TikTok | Dataset |
|---|---|---|---|
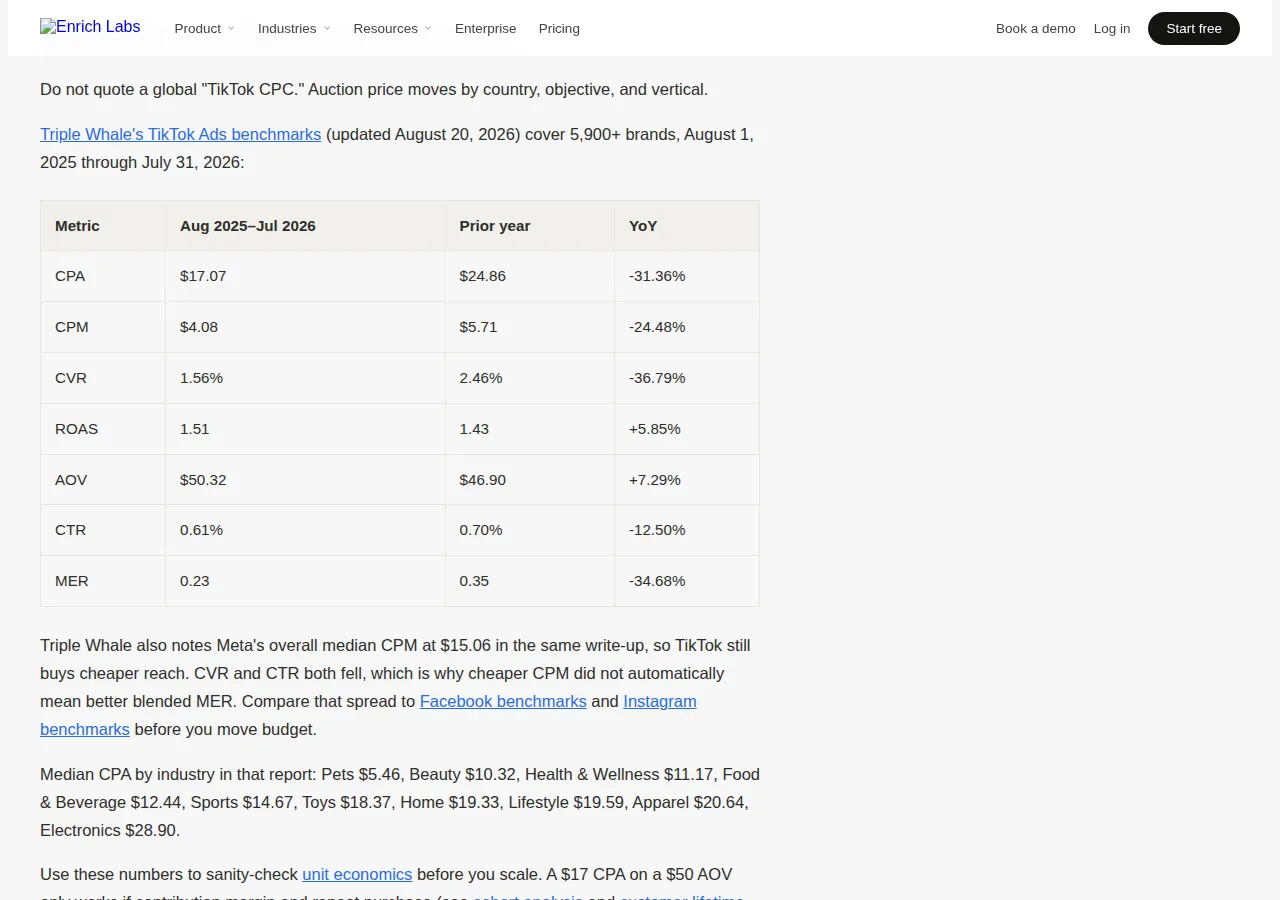
| CPM, all formats | $9 average, $1–$23 range | $4.08, ecommerce cohort | AdConversion; Triple Whale |
| CPV, skippable in-stream | $0.01–$0.05, average $0.05 | — | AdConversion; Store Growers |
| CPC | $0.50–$3.50, Demand Gen traffic | $0.79 in-feed, $1.08 Spark | Store Growers; DigitalApplied |
| CTR | 0.65% | 0.61% cohort; 1.18% in-feed retail | Strike Social; Triple Whale; DigitalApplied |
| View rate | 31.9% | — | Strike Social / Google benchmark data |
| CVR | — | 1.56% cohort; 2.6% Spark; 3.7% Shop checkout | Triple Whale; DigitalApplied |
| CPA | No named-vendor median; soft band $50–$150 ecommerce | $17.07 cohort; $32.24 in-feed | MB Adv 2026; Triple Whale; DigitalApplied |
| ROAS | — | 1.51x cohort; up to 2.70x apparel | Triple Whale |
| AOV | — | $50.32 | Triple Whale |
| Invalid traffic, retail | Not published | 5.56%, rising 3.94% to 6.61% | Lunio, 414 million retail clicks |
The YouTube CPA row needs a note of its own. MB Adv's 2026 cost guide states plainly that no named-vendor YouTube-specific CPA table exists, and gives a soft band instead: general $20–$100, ecommerce $50–$150, labelled low confidence and unattributed. The worked month prices YouTube on that band, so the result is a range, not a point — and the range's floor is the break-even at a $50 average order value.
The medians do not close — and that is the finding
Run the TikTok cohort figures as a funnel and they contradict each other. The CPM and CTR imply a cost per click of $0.67: $4.08 divided by 6.1 clicks per thousand impressions. At the published 1.56 percent conversion rate, that implies a cost per acquisition of $42.88 — against a published CPA of $17.07. The gap is not an error. It is the mix: the CPA median is dominated by TikTok Shop checkout, which converts at 3.7 percent, while the CVR median is dominated by external landing pages. At the Shop rate the funnel closes: $0.67 divided by 3.7 percent is $18.08, within $1.01 of the published $17.07.
The ROAS median fails the same test. Average order value $50.32 divided by the published CPA $17.07 implies a 2.95x return; the published ROAS is 1.51x. Medians of different distributions do not divide cleanly, and a buyer who plans on 2.95x because the AOV and CPA medians divide that way is planning on a number no brand in the dataset achieved. Plan on the published 1.51x, and treat the 2.95x as the arithmetic of two medians that never met.
The $10,000 month, run on both platforms
The worked month splits $10,000 evenly, $5,000 per platform, at a $50 average order value — a stated assumption, not a benchmark. Each line is derived from the published figures above, so the reader can re-run it with their own numbers.
YouTube, $5,000. At a $9 CPM the budget buys 555,556 impressions. At a 31.9 percent view rate that is 177,222 billable views, an effective $0.028 per view — inside the published $0.01 to $0.05 range. At a 0.65 percent click-through rate the impressions produce 3,611 clicks, an implied $1.38 per click, inside the $0.50 to $3.50 Demand Gen range. No published YouTube CPA median exists, so orders are priced on MB Adv's soft ecommerce band of $50–$150: at $50 the budget buys 100 orders, $5,000, and a 1.00x return; at $150 it buys 33 orders, $1,650, and a 0.33x return. The honest statement is a range, not a point — and the range's floor is exactly the break-even at a $50 average order value.
TikTok, $5,000, external landing page. At a $4.08 CPM the budget buys 1,225,490 impressions. At a 0.61 percent click-through rate that is 7,475 clicks, an implied $0.67 per click. At the 1.56 percent cohort conversion rate that is 117 orders, $5,850, and a 1.17x return.
TikTok, $5,000, Shop checkout. The same 7,475 clicks at the 3.7 percent Shop conversion rate produce 277 orders, $13,850, and a 2.77x return. The checkout, not the creative, is the difference: in-app checkout removes the landing-page drop-off that costs the external funnel 160 orders on the same spend.
The invalid-traffic adjustment
TikTok's retail invalid-traffic rate averaged 5.56 percent across retail accounts between Q4 2025 and Q2 2026, climbing from 3.94 percent to 6.61 percent, in Lunio's analysis of 414 million retail ad clicks. The platform-wide rate runs far higher at 24.20 percent, and the United States carries 8.44 percent against a $10.72 CPM. The adjustment is simple division: the real cost of a genuine acquisition is the published CPA divided by the share of real traffic.
On a $500,000 annual TikTok budget, a 5.56 percent invalid rate is $27,800 of spend reaching no real buyer a year — roughly 1,628 invalid conversion events at the published $17.07 CPA, feeding the bidding model alongside genuine purchases. YouTube publishes no comparable invalid-traffic rate in the sources this guide opened, so no YouTube adjustment is printed here. A buyer who adjusts TikTok and not YouTube is using the only rate that exists in public.
Learning budgets: the floor that decides the test
Neither platform optimizes on a handful of conversions. The working rule is 50 conversions a week before a bid strategy has enough signal, and the daily budget that buys them is the real minimum — Google publishes no video floor at all.
A $10,000 monthly test funds TikTok's learning phase at $333 a day; the same $10,000 funds YouTube's at $333 a day and does not reach the $357.14 floor of the soft band. Test one platform properly before testing both badly: run TikTok first at $3,658 a month, or raise the YouTube test to $10,714–$32,143 a month.
Who should NOT run both platforms
This playbook is for businesses with a video creative and a $50 average order value. It is not for everyone. A business with a $12 average order value cannot survive a $17.07 TikTok CPA or a $50–$150 YouTube CPA band at any volume, and should buy search or email instead. A business selling a $5,000 contract should not judge either platform on one-month ROAS — its sales cycle outlasts the attribution window, and the right metric is cost per qualified meeting. And a business that cannot run Shop checkout should not plan on TikTok's 3.7 percent conversion rate — that rate belongs to the checkout, not the ad.
Decision table: four operator shapes
| Operator | Primary platform | Why | Authority |
|---|---|---|---|
| Ecommerce, $50 AOV, Shop checkout live | TikTok | 3.7% Shop CVR closes the funnel at $18.08 implied CPA | Triple Whale; DigitalApplied |
| Ecommerce, external landing page only | Test YouTube first | 31.9% view rate at $0.028 a view; TikTok external CVR 1.56% | Strike Social; Triple Whale |
| High-ticket B2B, $500+ AOV | YouTube Demand Gen | Intent targeting; $50–$150 CPA affordable at $500 AOV | AdConversion; MB Adv 2026 |
| $10,000 test budget, no Shop | TikTok only, then YouTube | $121.93/day learning budget fits; YouTube needs $357–$1,071/day | Derived from the TikTok median and YouTube band |
Execution checklist
- [x] Pick the checkout before the platform. If Shop checkout is live, TikTok's 3.7 percent conversion rate is available; if not, plan on the 1.56 percent external rate.
- [x] Fund the learning phase first. Fifty conversions a week is $121.93 a day on TikTok and $357.14–$1,071.43 a day on YouTube at the soft CPA band.
- [x] Apply the invalid-traffic adjustment to TikTok. Divide the published CPA by 0.9444 before comparing it with YouTube, and audit quarterly as the rate climbs.
- [x] Re-run the funnel math with your own numbers every month. The published medians are a starting point and they do not close — your own CPM, CTR, and CVR either close or they do not, and that is the only comparison that matters.
The Google Ads vs Meta Ads playbook prices the search and social sides of the same budget, the TikTok vs Meta ecommerce playbook runs the TikTok numbers against Meta's auction Price the whole test with the ROI calculator before the first dollar is spent.
For still-image social buying rather than video, the Pinterest vs Snapchat ROAS playbook prices both on the same 3,000 dollar month.
For the storefront half of the same funnel, the TikTok Shop vs Instagram Shopping fees playbook prices both platforms per order.
For audio-first buying rather than video, the podcast advertising CPM playbook prices host-read and programmatic CPMs by genre.